The 48V battery voltage chart is a reference tool that shows the relationship between a 48-volt battery’s voltage and its state of charge (SoC). It helps users understand how much charge remains by correlating specific voltage levels to battery capacity percentages, ensuring efficient use and maintenance of the battery system.

What Is a 48V Battery Voltage Chart?
A 48V battery voltage chart maps the voltage output of a 48-volt battery against its remaining charge, showing the voltage at various states from full (100%) to empty (0%). This chart is essential for monitoring battery health and optimizing performance, especially for lithium-ion and lead-acid battery types commonly used in electric vehicles, golf carts, and solar systems.
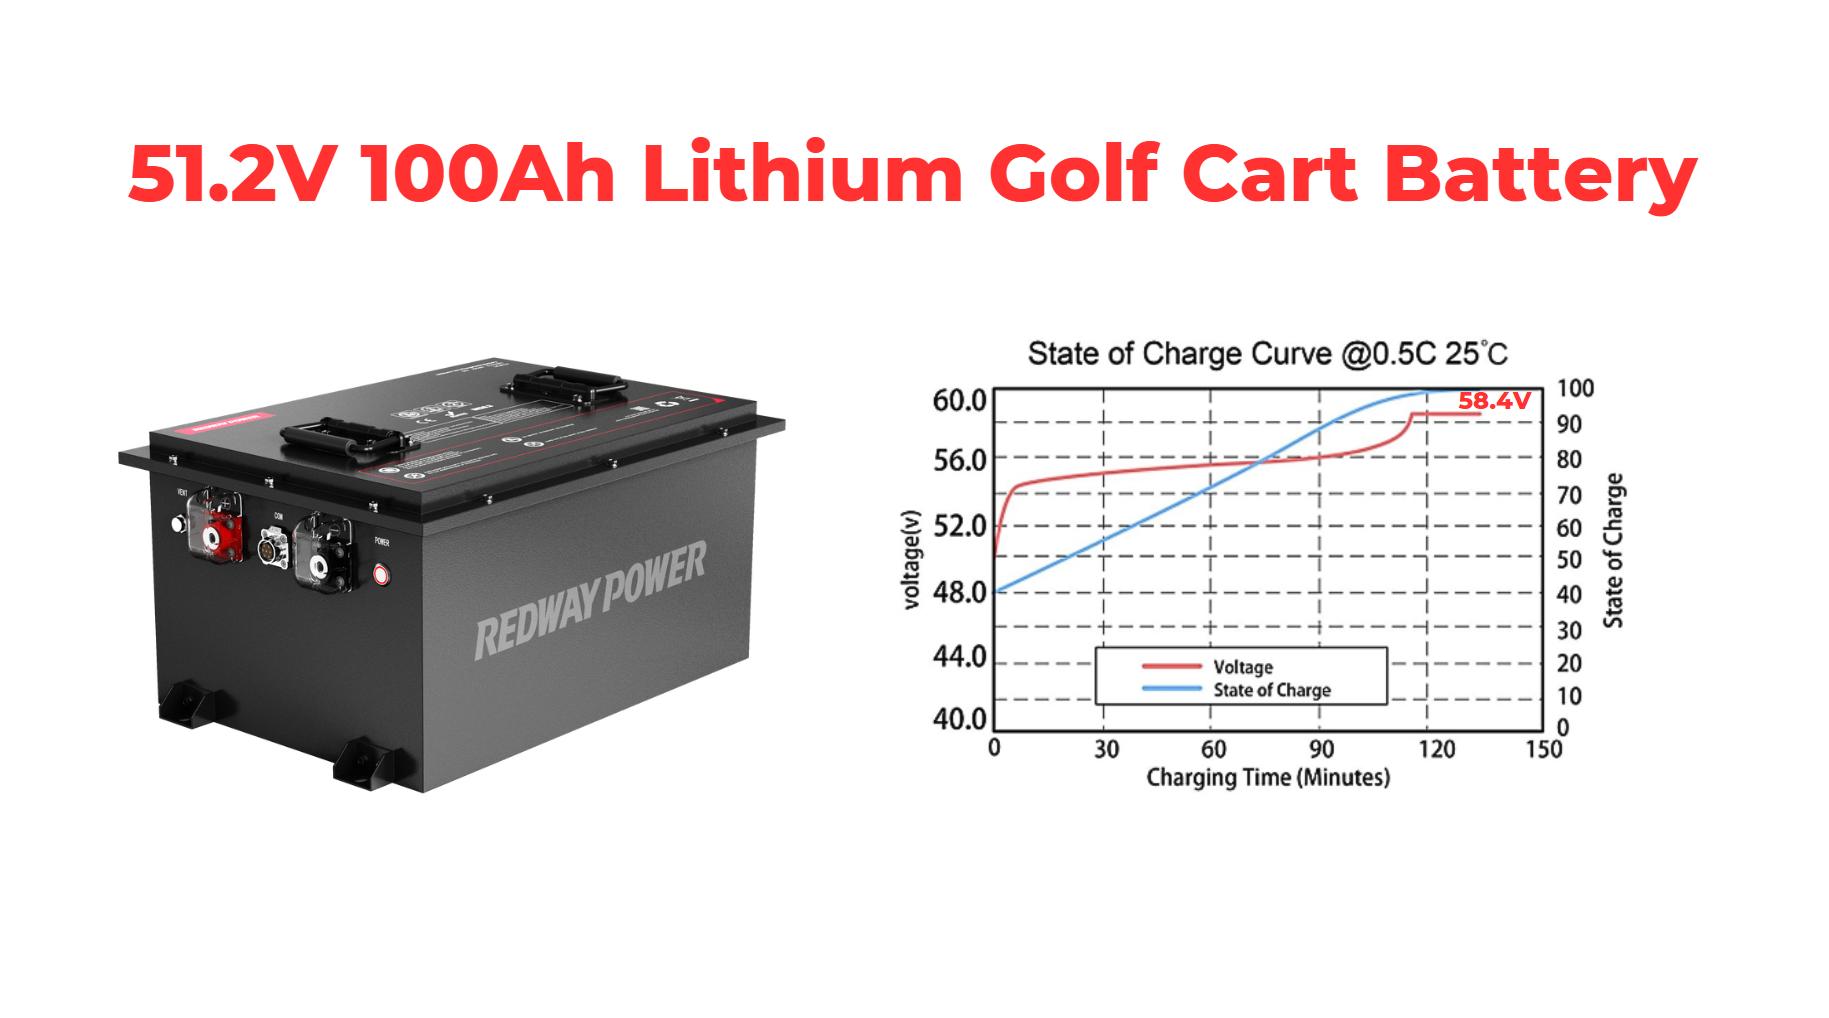
The chart indicates that as the battery discharges, voltage gradually decreases. Fully charged 48V batteries may reach over 58 volts (in lithium-ion types) or about 52 volts (in lead-acid types) resting, while a fully depleted battery voltage falls near 40 volts or lower. Knowing these values helps avoid deep discharge, which shortens battery lifespan.
How Does the 48V Battery Voltage Chart Help in Battery Management?
The 48V battery voltage chart aids in precise battery charge monitoring, preventive maintenance, and system efficiency optimization. By measuring voltage against the chart’s charge percentages, users can accurately assess how much usable energy remains without relying solely on time or usage estimates.
In practical applications like golf carts or forklifts, this chart allows operators to plan recharging and avoid excessive battery drainage. Additionally, it assists technicians in diagnosing performance issues or battery aging signs by comparing actual voltage against expected ranges for specific charge levels.
Why Is It Important to Use a 48V Battery Voltage Chart for Lithium-Ion Batteries?
For lithium-ion batteries, such as LiFePO4—which Redway Battery specializes in—the voltage chart is crucial because lithium batteries maintain relatively stable voltage until nearing full discharge. Without this chart, battery users might misjudge remaining charge and risk over-discharging, leading to reduced capacity and damage.

The chart from Redway Battery engineering shows a detailed state of charge linked to voltage values, helping users apply correct charging strategies and ensuring optimal battery lifespan and safety compliance.
Which Types of 48V Batteries Use Voltage Charts?
Voltage charts are useful for different 48V battery chemistries, primarily:
Lead-Acid Batteries: Voltage ranges from around 42V (empty) to 52V (full charge). These charts help monitor depth of discharge to prevent damage.
Lithium-Ion Batteries (LiFePO4): These show voltage from about 40V (empty) to over 58V (full charging state), with a relatively flat discharge curve. Specialized voltage charts reflect the precise discharge profile and charge thresholds managed by battery management systems.
Redway Battery offers a wide range of lithium-ion batteries with detailed voltage charts to guide maintenance and operational efficiency.
When Should You Refer to the 48V Battery Voltage Chart?
Regularly consulting the voltage chart during battery use, charging, and maintenance is recommended. Check voltage without load (resting state) to get accurate state of charge readings. Monitoring during charge cycles helps verify battery health and recharge completeness.
For industrial users and OEM clients of Redway Battery, integrating voltage chart checks in routine inspections ensures operational reliability and extends battery life cycles.
Can Voltage Charts Prevent Battery Damage and Improve Safety?
Yes, using a 48V battery voltage chart helps prevent battery damage by avoiding deep discharge and overcharge conditions. These conditions can severely reduce battery capacity and trigger safety hazards. Through accurate monitoring and timely charging, the chart helps mitigate risks, preserving battery integrity.
Redway Battery incorporates voltage chart data into their battery management systems to enhance product safety and durability across all applications, from forklifts to telecom energy storage.
How Do You Interpret a 48V Battery Voltage Chart?
Interpreting the voltage chart involves matching your measured battery voltage to the corresponding charge percentage. For example, a resting 48V LiFePO4 battery at about 52.3V indicates approximately 60% charge, while 48.0V means around 10% charge remaining.
Understanding these voltages helps users plan usage sessions, charging intervals, and maintenance, avoiding unexpected downtime.
| Voltage (V) | Charge (%) | Battery Type |
|---|---|---|
| 58.4 | 100 | LiFePO4 Charging |
| 54.4 | 100 | LiFePO4 Resting |
| 52.0 | 40 | Lithium-ion |
| 48.0 | 9 | Lithium-ion |
| 42.0 | 0 | Lead-Acid Empty |
Typical 48V voltage chart overview for lithium-ion and lead-acid batteries
What Are the Challenges of Using a 48V Battery Voltage Chart?
While the voltage chart is essential, variations in battery temperature, load conditions, and age affect voltage readings. Users must factor in these variables to avoid misinterpretation. Thus, using the chart with a quality voltage meter and in resting conditions improves accuracy.
Redway Battery’s engineering team customizes batteries and provides detailed voltage charts to customers, ensuring clarity on battery behavior over time and environmental conditions.
Redway Battery Expert Views
“At Redway Battery, we emphasize the importance of understanding 48V battery voltage charts for operational excellence. Accurate voltage-to-charge correlation empowers our OEM customers in industries such as material handling and energy storage to optimize fleet uptime and battery longevity. Our LiFePO4 battery solutions coupled with tailored voltage monitoring ensure safety, performance, and cost-efficient energy management.”
— Redway Battery Engineering Team
What Is the Future of 48V Battery Voltage Monitoring?
Emerging advances in smart battery management systems (BMS) integrate dynamic voltage charting, temperature compensation, and real-time data analytics. This innovation enables predictive maintenance and enhances battery safety across applications.
Redway Battery continues to innovate in battery technology and monitoring systems to deliver next-generation energy solutions tailored to evolving client needs.
Summary of Key Takeaways and Actionable Advice
The 48V battery voltage chart links voltage levels to battery charge percentages, aiding effective battery management.
Different battery types (lead-acid, lithium-ion) have distinct voltage-charge profiles; knowing these prevents damage.
Use voltage charts regularly in resting conditions for the most accurate charge status readings.
Redway Battery’s expertise and customized solutions enhance reliability in industrial and commercial battery applications.
Proper voltage chart usage prevents overdischarge, maintains safety, and extends battery life.
Future integration with smart BMS will further simplify and improve battery monitoring.
Frequently Asked Questions (FAQs)
Q1: Can I use a 48V battery voltage chart while the battery is under load?
A1: Voltage readings under load are typically lower and fluctuate. For accurate state of charge assessment, measure voltage when the battery is at rest.
Q2: How often should I check my 48V battery voltage?
A2: Regular checks during charging and scheduled maintenance optimize battery health and prevent deep discharge.
Q3: What happens if I over-discharge my 48V lithium battery?
A3: Over-discharge can permanently damage lithium batteries, reducing capacity and lifespan; voltage charts help avoid this by signaling low charge.
Q4: Does temperature affect the battery voltage reading?
A4: Yes, battery voltage can vary with temperature; colder conditions may lower voltage, so consider temperature adjustments when interpreting charts.
Q5: How does Redway Battery support customers in battery voltage management?
A5: Redway Battery offers detailed voltage charts, customized battery packs, and technical support to ensure optimal voltage monitoring and battery performance.